Querying ROS data with Grafana
This guide explains how to query ROS data directly from ReductStore and visualize it in Grafana. It expands on the visualization workflow introduced in the ROS applications guide.
The example queries individual GPS messages from the public ROS dataset and plots interval-averaged latitude and longitude.
To run the preconfigured example, you need Docker with Docker Compose.
The Compose service uses the reduct/grafana:latest image, which includes
Grafana and the ReductStore data source plugin. The public Play server provides
the required ReductROS and ReductSelect extensions.
For a custom deployment, you need:
- Grafana 10 or newer;
- version 1.3.0 or newer of the ReductStore data source plugin; and
- a ReductStore server with the ReductROS and ReductSelect extensions.
Both extensions are available with ReductStore Pro.
See the Grafana integration guide for plugin installation and compatibility requirements.
Start Grafana
The ROS example includes the following Grafana service:
grafana:
  image: reduct/grafana:latest
  restart: unless-stopped
  ports:
    - "127.0.0.1:3000:3000"
  volumes:
    - ./grafana/datasources.yml:/etc/grafana/provisioning/datasources/datasources.yml:ro
It mounts this read-only provisioning file, which configures the ReductStore
data source to query the public Play server:
apiVersion: 1
datasources:
  - name: ReductStore
    uid: reductstore
    type: reductstore-datasource
    jsonData:
      serverURL: https://play.reduct.store
    secureJsonData:
      serverToken: reductstore
Clone the documentation repository, enter the example directory, and start Grafana:
git clone https://github.com/reductstore/website.git
cd website/docs/ros/example
docker compose up -d grafana
Open http://localhost:3000 and sign in with the default username admin and
password admin.
Change the default Grafana credentials for any non-local deployment. The Play
server and its reductstore token are shared demo resources; do not send private
data to this server or use the demo token in production.
To query your own ReductStore instance, replace serverURL and serverToken in
grafana/datasources.yml. That server must provide ReductROS and ReductSelect,
and each raw ROS entry must have the $schema attachment needed for decoding.
Plot GPS coordinates
Create or edit a time-series panel, then configure its query:
- Select the
ReductStoredata source. - Set the dashboard time range to Last 1 hour.
- Select the
orionbucket and thePablo05/sensor/gps/fixentry. - Set Scope to Content Only.
- Enable Combine frames.
- Paste the following condition into the JSON editor and run the query:
{
  "#ext": [
    {
      "ros": {
        "extract": {}
      }
    },
    {
      "select": {
        "export": {
          "duration": "$__interval"
        }
      }
    },
    {
      "select": {
        "sql": "SELECT AVG(latitude) AS lat, AVG(longitude) as long FROM ENTRY()"
      }
    }
  ]
}
The #ext array runs an ordered server-side pipeline:
ros.extractuses the entry's$schemaattachment to decode each CDR message into JSON.- The first
selectstage usesexport.durationto batch rows according to their source timestamp span, using Grafana's resolved$__intervalvalue. Because this step has no SQL query or format conversion, it only batches the decoded JSON and avoids unnecessary SQL parsing and execution. - The second
selectstage runs the SQL query to average each batch and emits the numericlatandlongseries.
Grafana adjusts $__interval to the selected time range and panel width. This
keeps the point density suitable for the panel while preserving more detail over
narrower ranges. Combine frames keeps both output fields in one Grafana result
frame.
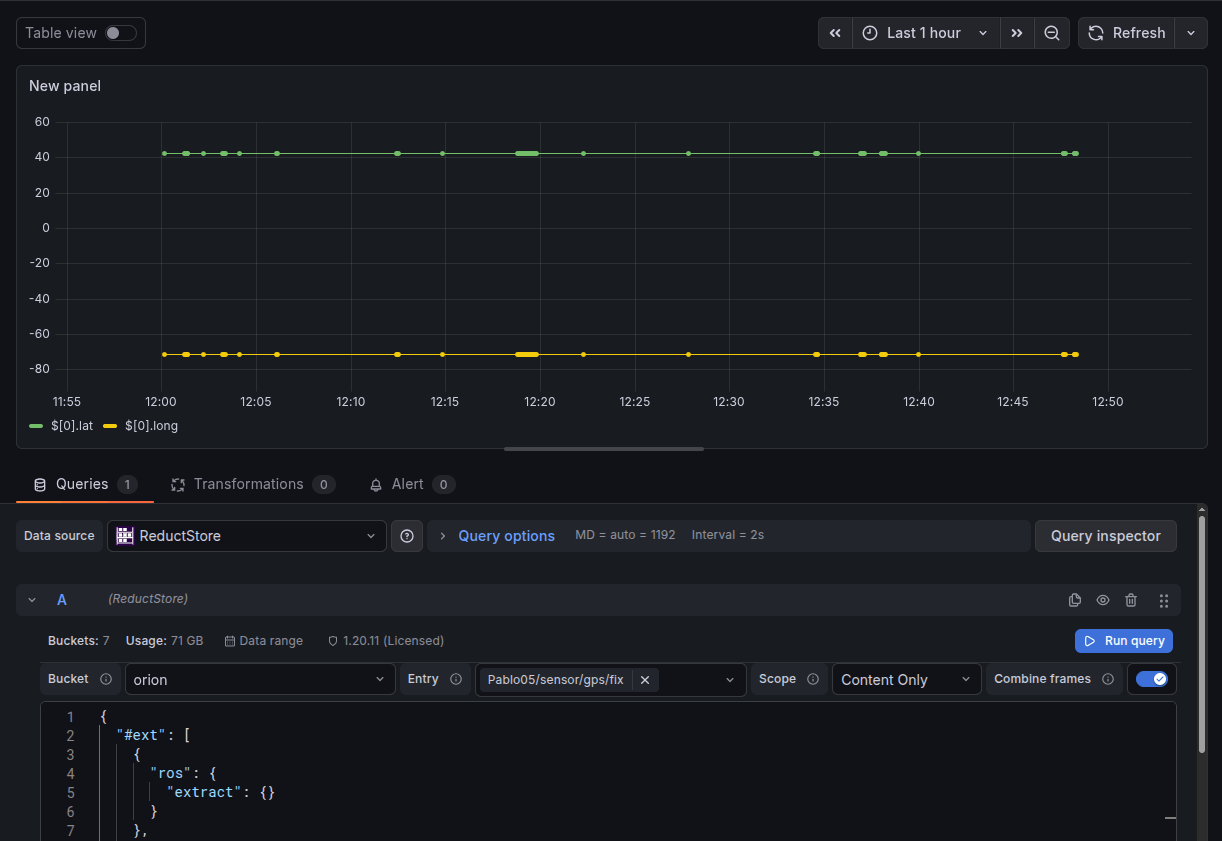
The plugin flattens the combined JSON result, so the legend names may appear as
$[0].lat and $[0].long rather than the bare SQL aliases.
Troubleshooting
If the panel is empty or one of the series is missing, verify that:
- the selected entry contains
latitudeandlongitudefields; - the entry has the
$schemaattachment required by ReductROS; - ReductROS and ReductSelect are available on the queried server;
- the selected time range contains records for the entry; and
- Combine frames is enabled.