Grafana
ReductStore provides a Grafana data source plugin that lets you pull time-series data directly from ReductStore buckets into Grafana dashboards. This gives you the ability to build charts, alerts, and monitoring panels on top of your stored data without exporting or transforming it elsewhere.
Installation
Grafana Requirement
Before installing the ReductStore plugin, make sure your environment meets the following Grafana requirements:
Grafana Version
The plugin is compatible with Grafana version 10 and above. Please ensure your Grafana installation meets this requirement.
If you don't have Grafana installed yet, follow the official Grafana Download Page to set it up on your system.
Allow Unsigned Plugins
This plugin follows standard Grafana plugin development practices but has not yet been published on the official Grafana Marketplace. Because only Marketplace plugins are signed by Grafana, manual installations like this one require enabling unsigned plugins in your Grafana configuration.
To allow unsigned plugins, add the following line to your grafana.ini file (typically located at /etc/grafana/grafana.ini) under the [plugins] section:
[plugins]
allow_loading_unsigned_plugins = reductstore-datasource
Download the Plugin
Download the plugin from the ReductStore Grafana Plugin releases page on GitHub. Each release includes a ZIP archive containing the plugin files. Simply select the most recent release and download its ZIP package (for example, reductstore-grafana-1.0.0.zip).
Install the Plugin
- Extract the ZIP file to get the
reductstore-grafanafolder. - Move the folder into your Grafana plugins directory (on linux, this is usually
/var/lib/grafana/plugins). - Restart Grafana so it loads the plugin:
sudo systemctl restart grafana-server
# or for Docker
docker restart <grafana-container-name>
- Check the logs to ensure the plugin loaded without errors:
sudo journalctl -u grafana-server | grep reductstore
# or for Docker
docker logs <grafana-container-name> | grep reductstore
Data Source Configuration
Add the Data Source
To add ReductStore as a data source in Grafana:
- Go to Add new connection in the Grafana sidebar.
- Seach for ReductStore.
- Select ReductStore and click Add new data source.
Required Settings
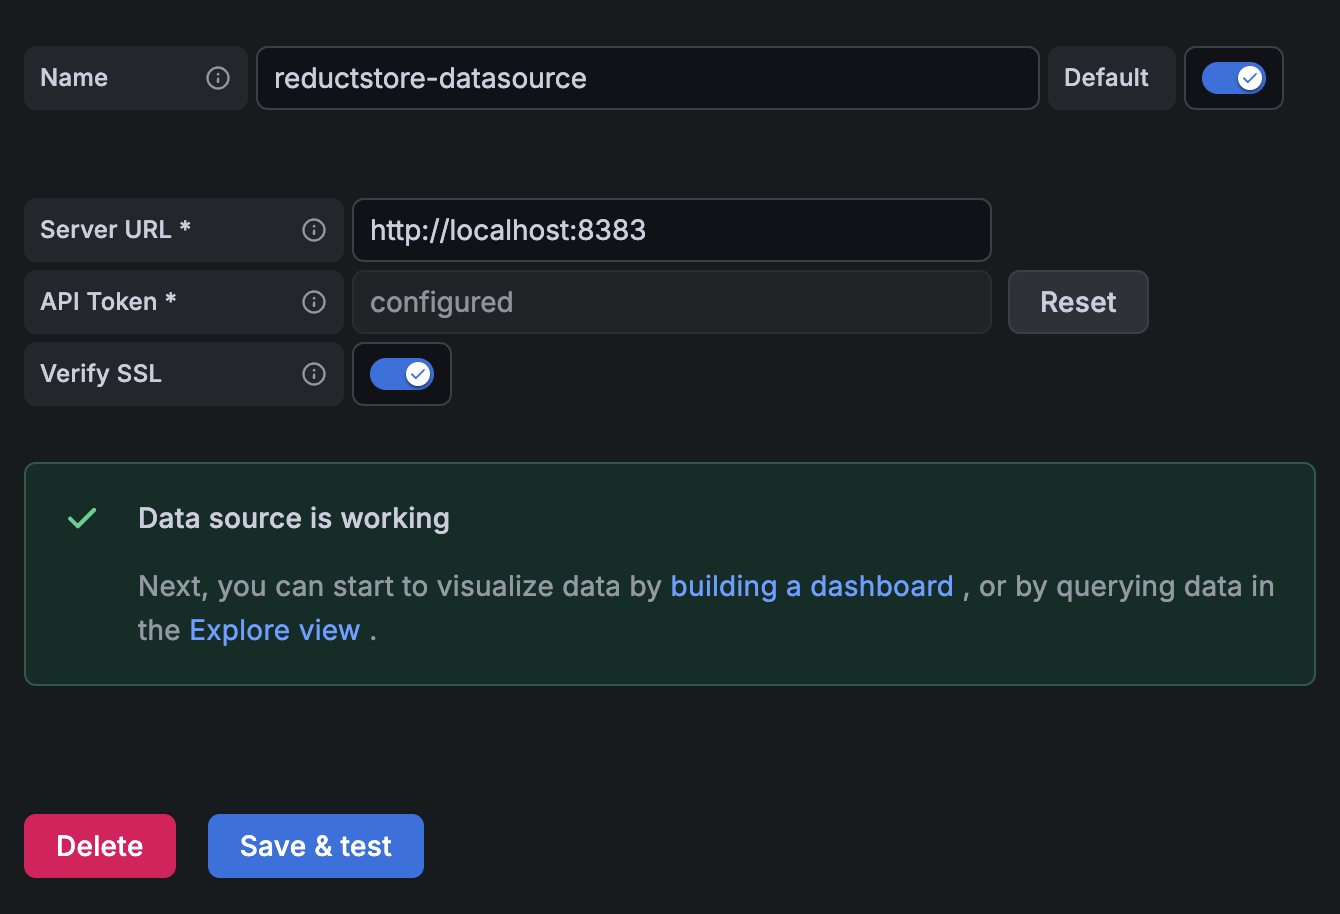
Fill in the following fields:
- Server URL: your ReductStore instance, e.g.
http://localhost:8383 - API Token: optional, only needed if authentication is enabled
- Verify SSL: enabled by default. Keep it on for production and disable it only for testing or when you explicitly want to skip TLS certificate verification
- CA Certificate Path: optional path to a PEM-encoded CA certificate on the Grafana host. Use this when your ReductStore server uses a private or self-signed certificate authority
Test the Connection
Click Save & Test. If the setup is correct, Grafana will show a success message.
For self-signed HTTPS setups, prefer setting CA Certificate Path and keeping Verify SSL enabled. Disabling SSL verification is less secure and should only be used for temporary testing.
Querying Data
Query Builder
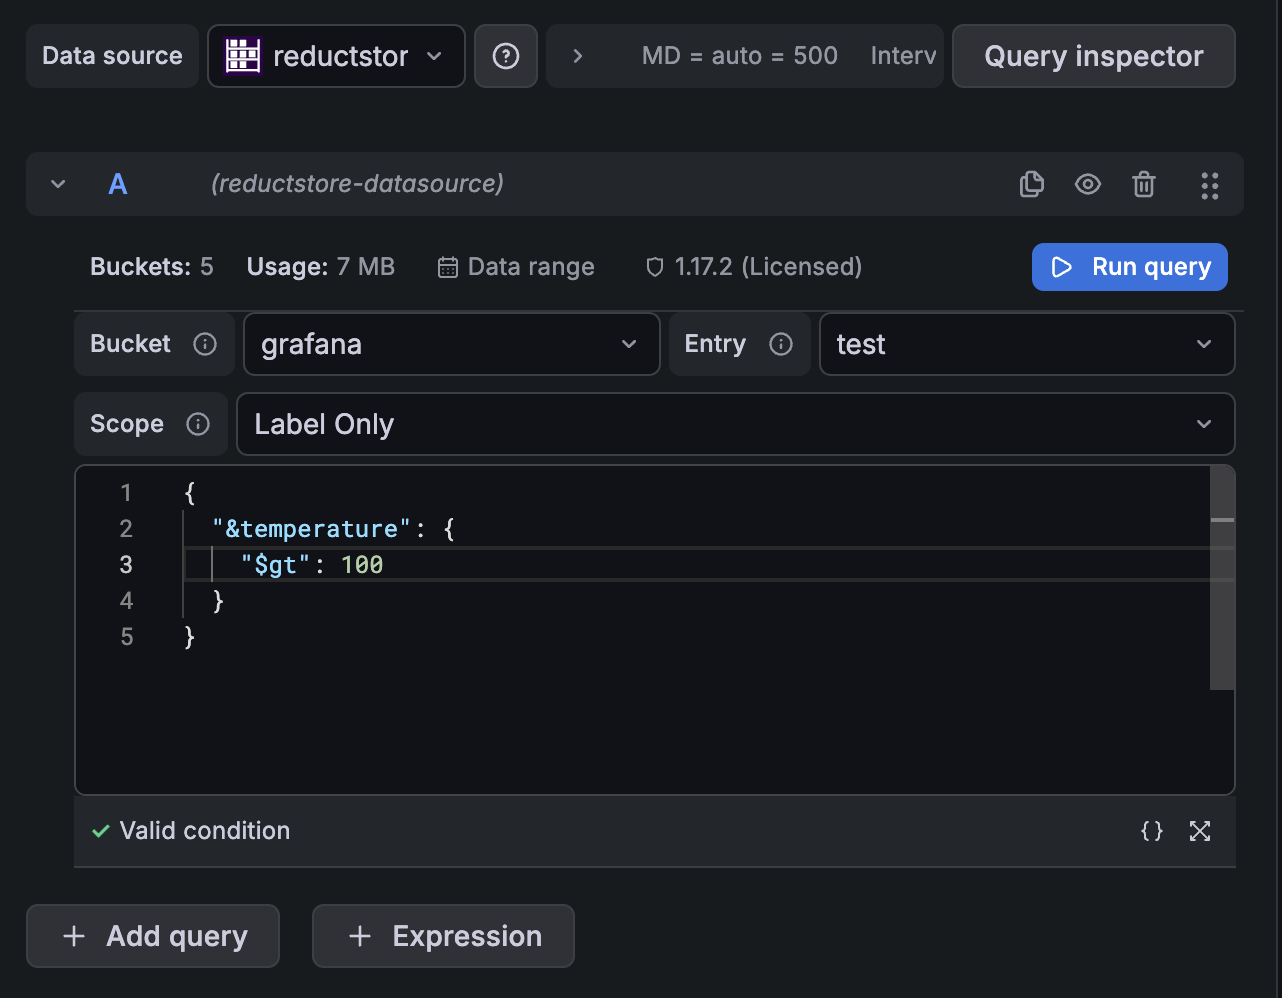
The plugin includes a query builder where you select the bucket, entry, and mode (labels, content, or both). There is also a JSON editor available for writing Conditional Queries that allow you to filter records based on labels and extract specific fields from record contents.
Query Modes
Labels Only
Use this when you're only interested in getting labels from records. This makes sure that only metadata is transferred to Grafana. If you have many labels but only need a few, you can use the #select_labels directive to specify which labels to include in the results.
For example, to get only records where the temperature label is greater than 25.0, and include only the temperature and humidity labels in the results, you can use the following query:
{
  "&temperature": {
    "$gt": 25.0
  },
  "#select_labels": ["temperature", "humidity"]
}
Content Only
To extract specific fields from record contents, you need ReductStore extensions to be installed on your ReductStore server.
For example, to extract only the temperature field from JSON records, you can use the ReductSelect Extension to specify the desired field:
{
  "#ext": {
    "select": {
      "json": {},
      "columns": [
        {
          "name": "temperature"
        }
      ]
    }
  }
}
Labels and Content
Query the full records including both labels and content. You can combine label filters and content extraction as needed.
Grafana $__interval Macro
The plugin supports Grafana's built-in $__interval macro. It automatically adjusts the query interval to match the dashboard time range.
{
  "$each_t": "$__interval"
}
This makes it easy to create dynamic dashboards that adapt to different time ranges without manual adjustments.
Automated Provisioning
Grafana supports provisioning data sources via YAML files. To provision ReductStore automatically, add a file like below to your Grafana provisioning directory (e.g. /etc/grafana/provisioning/datasources/ on Linux).
Example YAML file (reductstore.yaml):
apiVersion: 1
datasources:
  - name: reductstore
    type: reductstore-datasource
    jsonData:
      serverURL: http://localhost:8383
      verifySSL: true
      caCertPath: /etc/ssl/certs/reductstore-ca.pem
    secureJsonData:
      serverToken: your_api_token
Parameters
| Parameter | Description | Required |
|---|---|---|
name | Display name in Grafana | Yes |
type | Must be reductstore-datasource | Yes |
serverURL | URL of your ReductStore instance | Yes |
verifySSL | Enable TLS certificate verification. Defaults to true when omitted | No |
caCertPath | Path to a PEM-encoded CA certificate file on the Grafana host | No |
serverToken | API token for authentication | No |
Deployment Steps
- Place the YAML file in Grafana's provisioning directory.
- Restart Grafana.
- The ReductStore data source should appear automatically in the Data Sources list.
More details on provisioning can be found in the Grafana Provisioning Documentation.